
Our data analysis team aims to support our athletes by providing them with information and tools they can easily and effectively use to improve their performance. The team has been working on Rocket League next to League of Legends the past couple of months. For Rocket League, we are working on basic positioning and boost usage statistics. These are statistics that are not provided to players in-game, but are two of the most important skills a good Rocket League athlete has to master. All these statistics and tools are packaged into a dashboard, that aims to help coaches and players to analyse games more efficiently and effectively. In this article we explore what very simple positioning information (heatmaps) can already tell us about the course of a match in Rocket League.
Let us start by looking at a game between Esports Team Twente and Northern Lions on the 7th of December, 2020. This game was taken as a case study by data analysts at Esports Team Twente because the game was very close even though Esports Team Twente ‘felt’ like they were dominating the game.
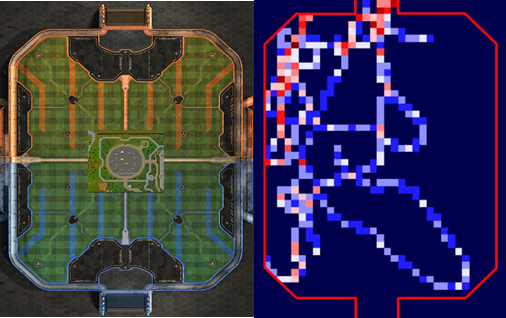
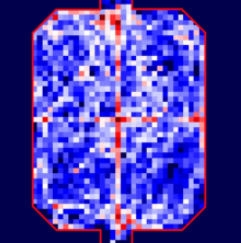
Without looking at the final score of the game, let us first perform two very simple analyses on the replay data file of the game. Firstly, we will look at the overall pressure on the teams during the game. A simple way to do this is to look at differences in heatmaps during the game. Below, you can see the heatmaps for the first and second half of the match (please note the heatmaps are not smoothed, red means more player activity, blue means less):
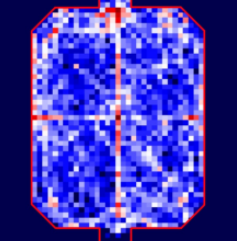
In the figures above, we can see a clear difference between the two halves of the game. In the left figure, we can see the game is played a lot on the upper-left corner of the field. In addition to this, players of Northern Lions can be found concentrated around their goal (top of the figure). Meanwhile, the bottom half of the field looks much quieter than the top half. This means the first half of the match was mostly played on the side of Northern Lions. This could explain why Esports Team Twente felt like they were dominating the game for a while: the Northern Lions players had retreated to their own goal.
In the second half (the right figure), we can still notice a lot of activity around the Northern Lions’ goal. However, now we also see some activity around the goal of Esports Team Twente. Activity around both goals is usually expected in high-level matches, so the first half was exceptional. From this positional data, we could assume that if Northern Lions had made any goals, they most likely were made in the second half, as they were less defensive. Esports Team Twente could have made goals throughout the match, but it is likely they made most of their goals during the first half.
This is exactly what happened: Esports Team Twente made two goals during the first half of the match. After three minutes, Northern Lions managed to break out of their defensive position and score one goal of their own, ending the game in a score of 2-1 for Esports Team Twente.
For fun, let us quickly look at one of the goals. Below, you can see the combined heatmap of all players in the game during 15 seconds.
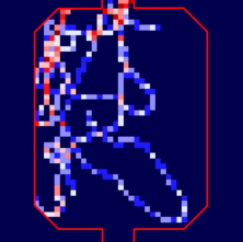
In the figure above, we can see the game being very concentrated on the half of Northern Lions. We can see some players are positioned in the back of their goal. Also, they are positioned on the wrong side of the goal, compared to the overall activity of the other players. Indeed, when looking at the replay, the goal was scored on the left side of the goal: the player positioned on the back-right of the goal could not get to the ball in time.